Dashboard
The Analytics Dashboard provides a comprehensive view of document processing activity, token usage, and system performance. It helps users monitor consumption trends, identify peak activity hours, and optimize template usage.
Step 1: Monitor Token Usage
Token Usage Overview
- Displays tokens used, tokens remaining, and overall usage rate.
- Helps track subscription limits and manage consumption efficiently.
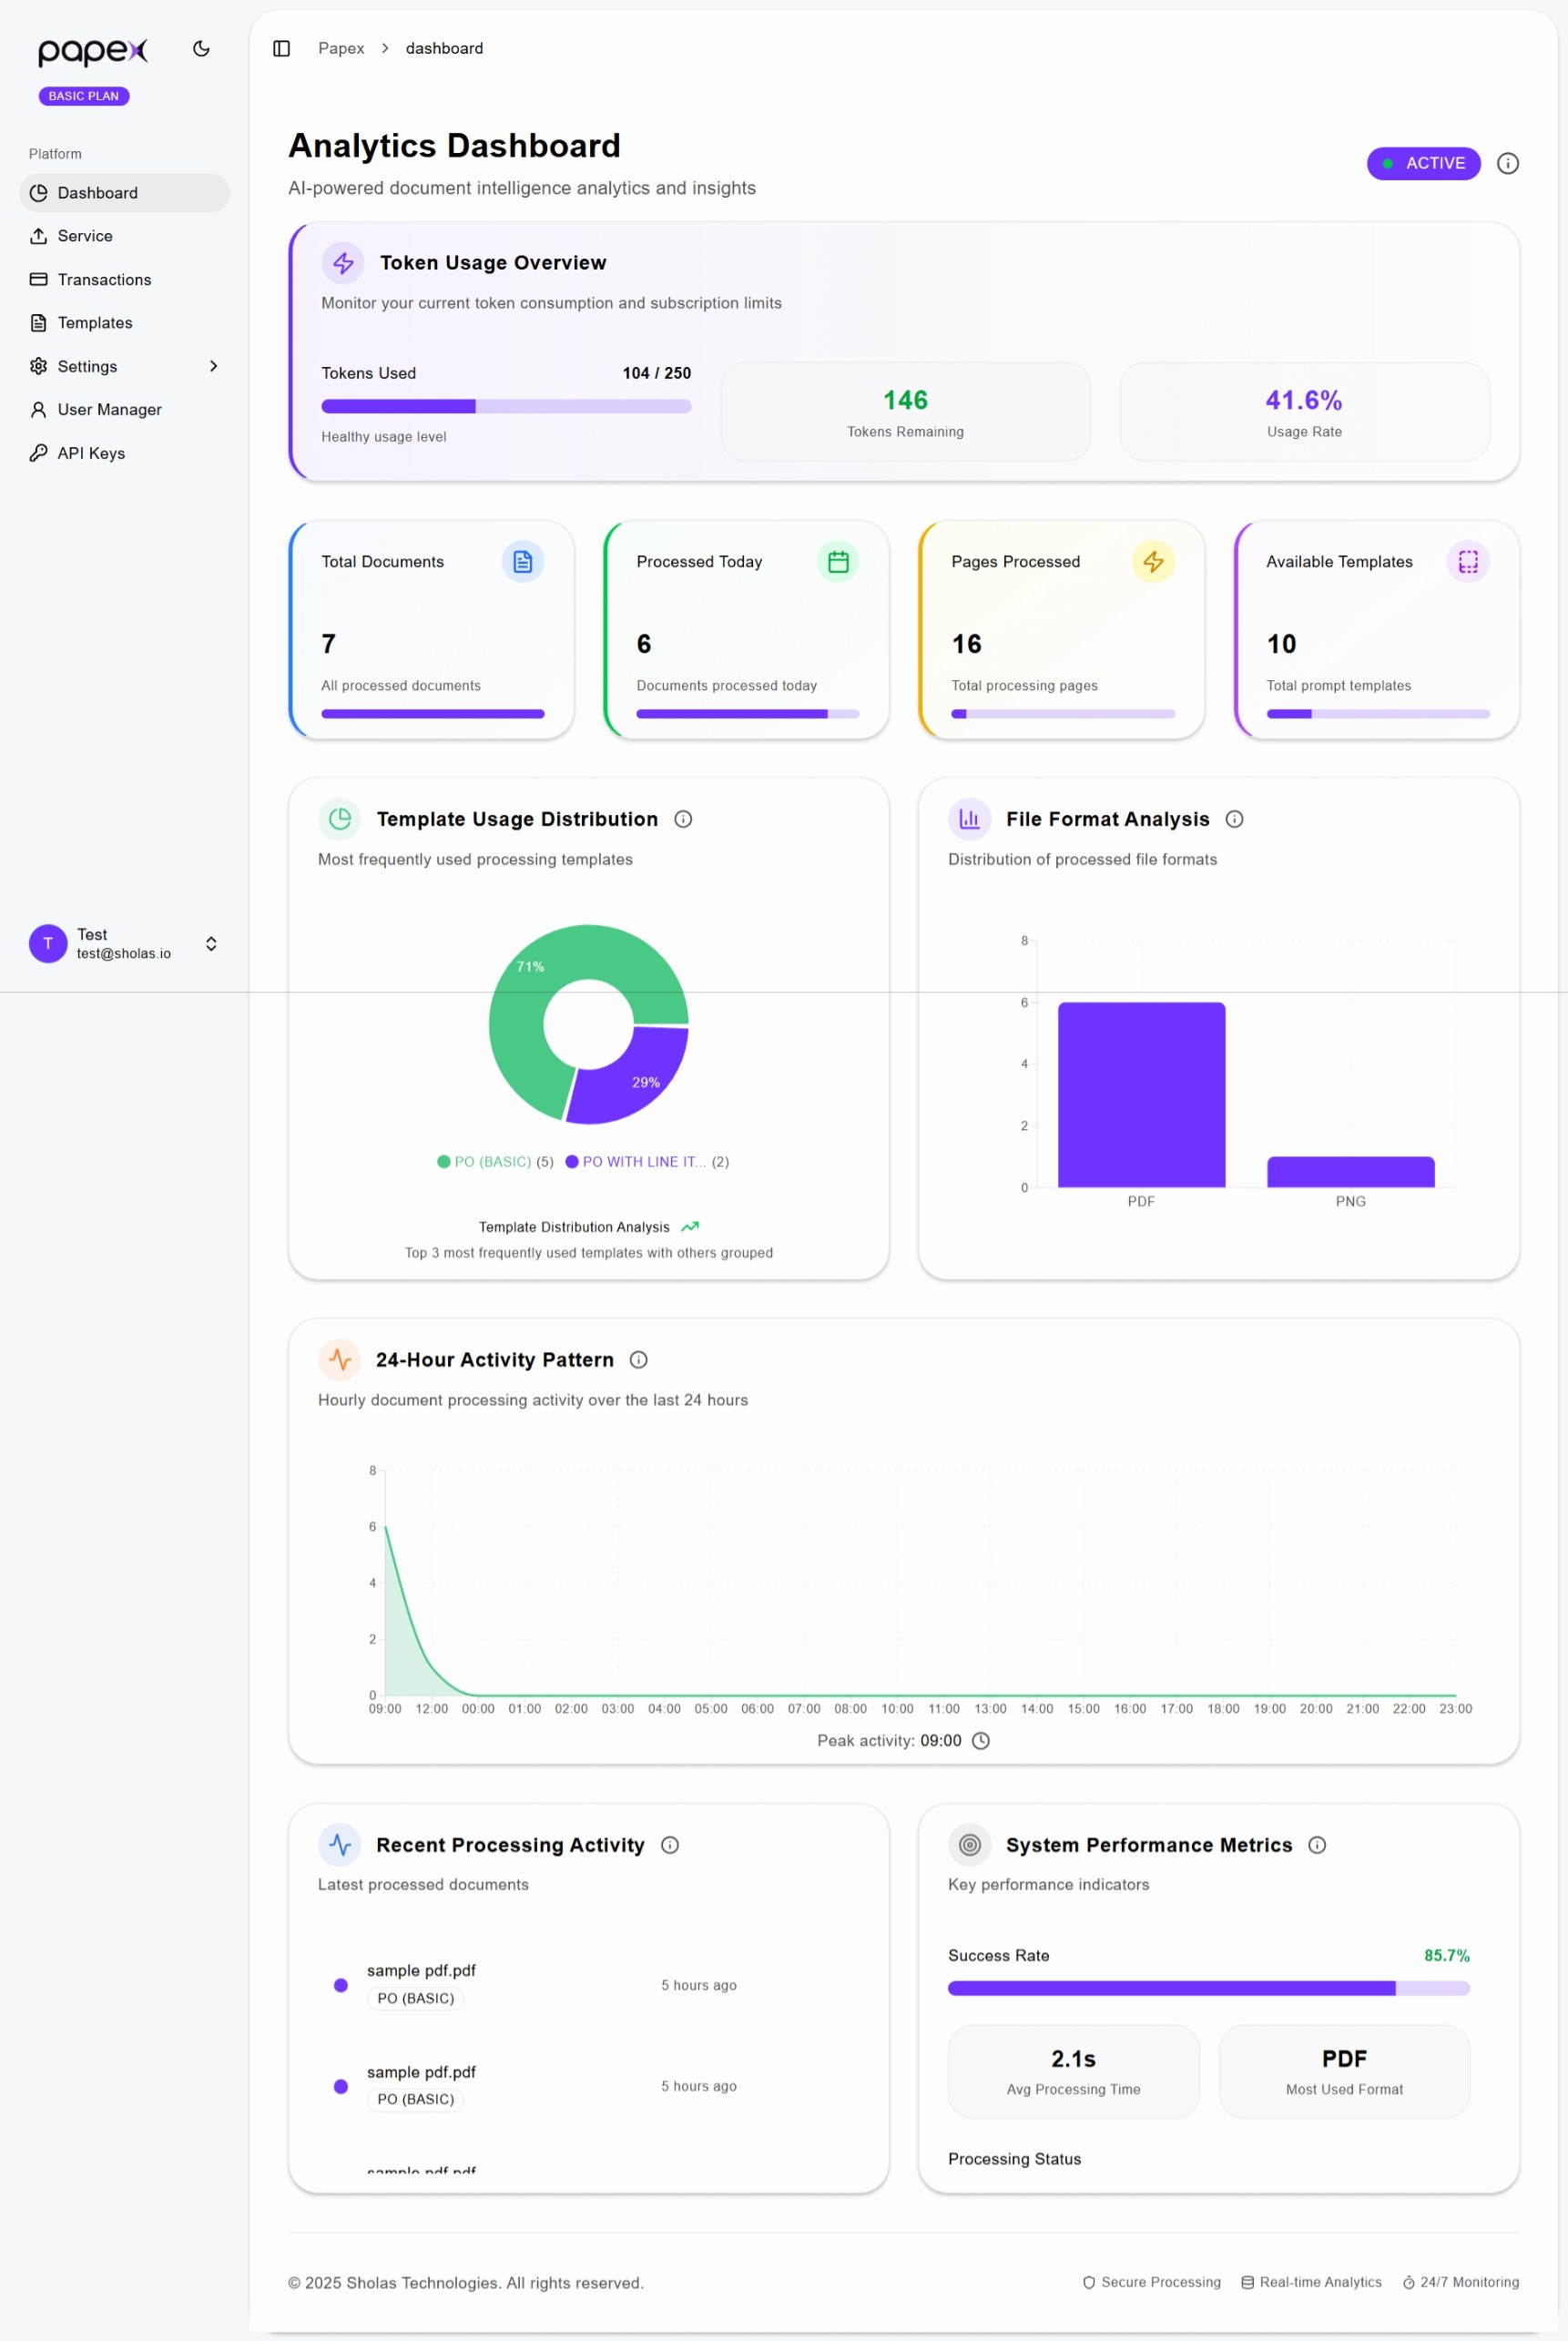
Step 2: View Document Processing Summary
- Total Documents – Shows the cumulative number of processed documents.
- Processed Today – Indicates how many documents were handled on the current day.
- Pages Processed – Displays the total number of pages extracted.
- Available Templates – Lists the number of active templates configured.
Step 3: Analyze Template Usage
Template Usage Distribution
- Pie chart showing frequency of template usage.
- Useful for identifying popular templates and refining template strategy.
Step 4: Review File Format Analysis
File Format Distribution
- Bar chart showing types of processed files (e.g., PDF, PNG).
- Helps understand format trends and optimize processing logic.
Step 5: Monitor 24-Hour Activity Pattern
Hourly Activity Graph
- Displays document processing volume across each hour.
- Useful for identifying peak operational windows and scheduling tasks.
Step 6: Review Recent Processing Activity
Recent Activity Log
- Lists recently processed documents with timestamps.
- Helps track ongoing tasks and verify recent uploads.
Step 7: Monitor System Performance Metrics
Performance Indicators
- Includes API pushed data’s success rate, average processing time, and most used format.
- Assists in evaluating system efficiency and reliability.